Gantt Charts Decoded: A Quick and Easy 5-Minute Guide for You
Introduction to Gantt Chart
A Gantt chart is a kind of bar chart that illustrates the schedule of a particular project plan. More commonly known as a Gantt chart after Henry L. Gantt, who used the chart in the early twentieth century, it is a continuous line depicting and monitoring a project’s timeline. This is important because it shows the tasks in a project plan, and their relation to other tasks, time frames, and special notes (Ramachandran & Karthick., 2019).
Use of Gantt Chart in Project Management
- Visual Timeline: Gantt charts offer a project overview to give stakeholders a complete picture of how the project is scheduled.
- Task Tracking: It helps to know which of the tasks are complete, which are in process, or which those waiting to be done next.
- Resource Allocation: Distribute all team members to specific duties and allocate the available resources so as not to overload someone (Wadhwa., 2024).
Key Gantt Chart Components
Gantt Chart includes the following components:
- Tasks: They are these small activities that are broken down from a given project. Each task shows what is required as an activity or checkpoint, for example, “Wireframes to be produced,” or “To train the team”.
- Timelines: These make the horizontal axis; or the length of your project in the format of time. Having dates along the top makes it easy for you to look at when certain tasks begin and even when they are due to end.
- Milestones: They are usually marked events or goals on a timeline. For instance, after “Project launch,” could be a critical event. These are usually represented with different symbols such as the diamond.
- Dependencies: There are circumstances in a task that will require the other prior tasks to be executed before it is commenced. These are depicted by the lines joining the various tasks in order to eliminate the creation of bottlenecks.
- Progress Indicators: Shaded bars indicate how far the particular project is completed, to provide a brief update on any particular project that a person is working on (Wadhwa., 2024).
How to Read a Gantt Chart
- Timeline: TIt tells about the project duration and arranges deadlines, in days, weeks, and months on a horizontal axis.
- Task Bars: The horizontal taskbars are located at the top of the corresponding vertical axis and represent the beginning and the end of each task. The fact of its length contributes to the indication of the duration of tasks.
- Dependencies: Double-headed arrows between the task bars show that they are related. For instance:
1. Finish-to-start dependency: Task B is performed after the completion of Test A.
2. Start-to-start dependency: Two activities start concurrently. - Tracking Progress: The completion level is marked in the colors or the shading within the associated task bars. This way it is simple to identify activities that are behind the set schedule or those that were planned ahead of the schedule (Bianconi., 2024).
How to create a basic Gantt chart, software, or spreadsheet
- Choose Your Tool: A Gantt chart is entirely possible and can be made using tools such as Microsoft Project, Asana, or Smartsheet but specifically for managing projects. But for a small project, one works with a simple spreadsheet in Microsoft Excel or Google Sheets (Caballero, et al., 2011).
- Define Your Project Tasks: Make a list of all activities so they can be described both concisely and comprehensively. In other words, more sub-tasks should be incorporated to improve the monitoring of progress to a general aim or particular objectives. Then drag and drop the tasks in the timeline.
- Set Deadlines and Allocations: Drag the edges of the taskbars to provide the start and end date of each task you want to be generated by the system and if internal software is employed in the allocation process, then we can assign specific team members directly.
- Establish Dependencies: When there is a link between two events, use the opportunity to link tasks that show the progression of events.
- Customize and Visualize: Available themes and templates are perfect for creating a professional appearance or, customizing each bar and timeline feature using drag and drop (Evdokimov, et al., 2011).
Significance of Gantt Charts for Project Management
- Scheduling: It takes major work areas of projects, defines them into parts, and highlights larger activities.
- Coordination: It is very easy to improve collaboration between the team members and give them a general view of the direction.
- Efficiency: It is useful in terms of time, immediately indicates a slowdown, and prevents its further development (Vasankari., 2024).
Tips to make Gantt charts in your workflow
- Regular Updates: Make your chart interactive by re-visiting and updating the chart along the allotted tasks.
- Collaborate: Make the chart available to other team members so that there is openness.
- Use Color Codes: Use color to differentiate between tasks: type, priority, or status. Monitor Progress: It is crucial to cross-check the actual working progress set time to timetable time frequently (Wadhwa., 2024).
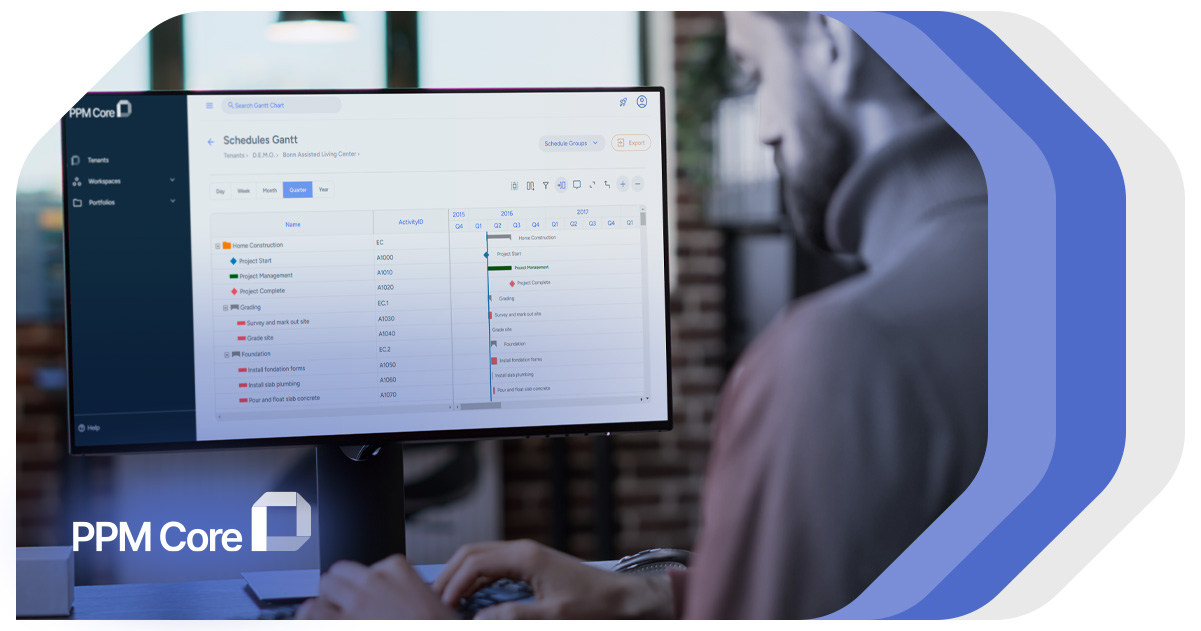
In this context, we must highlight PPM Core as a valuable digital software solution that can help integrate Gantt Charts more smoothly into work processes.
PPM Core has useful features like the Universal Project Viewer, which allows project managers and their teams to view schedule data from different software tools in a Gantt Chart format. This enables them to have one reliable point of reference to improve the management of schedules.
This cloud-based project management tool integrates all the members, and the information related to the specific project and makes it easier for teams or organizations to work on the projects in an efficient manner without any barriers.
Conclusion:
Gantt Charts are a smart tool for informing project management since they break down the project’s tasks, timeline, and achievable resources. Regardless of whether these tools are used for simple projects or complex processes, they are extremely helpful aids in providing organization, increased understanding, and improved interaction between teams as well as other interested parties. Since every project has its plan on one chart, Gantt charts help minimize the probability of delays and improve the planning section.
References
Bianconi, F. (2024). Gantt Charts. In Data and Process Visualisation for Graphic Communication: A Hands-on Approach with Python (pp. 175-181). Cham: Springer Nature Switzerland.
Caballero Villalobos, J. P., Jarro Sanabria, S. P., & García Cáceres, R. G. (2011). Activity scheduling through gantt charts in an ms excel spreadsheet. Revista Facultad de Ingeniería Universidad de Antioquia, (61), 132-145.
Evdokimov, I. V., Tsarev, R. Y., Yamskikh, T. N., & Pupkov, A. N. (2018). Using PERT and Gantt charts for planning software projects based on distributed digital ecosystems. In Journal of Physics: Conference Series (Vol. 1074, No. 1, p. 012127). IOP Publishing.
Ramachandran, K. K., & Karthick, K. K. (2019). Gantt chart: an important tool of management. International Journal of Innovative Technology and Exploring Engineering, 8(7), 2278-3075.
Vasankari, P. (2024). The Effect of Project Communication and Project Performance: The Role of Detailed Gantt Chart in Substation Construction Project.
Wadhwa, K. (2024). The Role of Gantt Chart in the Project Management.


